November was the best month for the stock markets since 2008. The S&P 500 equity index rallied 9% and the bond market did well too with the 10-year Treasury yield dropping from 4.91% to 4.35%. The best performing sector in the S&P 500 was the Finance sector. Regional banks have been under pressure as the Fed Funds rate increased over the past year and competition over bank deposits became fierce. The spread between borrowings costs and lending rates narrowed. That borrowing cost pressure eased in November with the decline in interest rates.
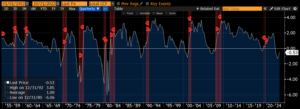
The market performed well based on the investor narrative of softening interest rates. The question on the economy however still remains murky with many leading economic indicators pointing to an upcoming recession. One of these indicators is the 10-year Treasury bond yield minus the Fed Funds rate. When this equation is negative, it has historically indicated an upcoming recession.
10-Year Treasury Yield minus the Fed Funds Rate*

*REC bands indicate US Recession.
Inflation vs Recession
Two major risks to the market right now are 1) a higher inflation rate and 2) an increased probability of an upcoming recession. Inflation has dropped from a high of 9.1% last year to 3.2%.
In addition to the yield curve spread shown above, other economic indicators that point to a recession include 1) the Leading Credit Index, 2) Average Consumer Expectations for Business Conditions, and 3) Manufacturing New Orders. On the other hand positive economic indicators include 1) Builders Permits for Private Housing, and 2) Unemployment Insurance claims.
The stock market has recently done well in this Goldilocks economic environment where economic activity is not too hot as that would lead to higher inflation, and not too cold as that would lead to an economic downturn.


