

The S&P 500 has been on a historic run over the past several years. More specifically, the last three years from 2023 through 2025, have produced consecutive double-digit gains for the index. Last year was yet another strong performance, with the S&P 500 index up just over 17% for the year. During extended bull markets like this, investors often experience conflicting emotions at the same time: fear of missing out on further gains, while others believe the rally will never end. Both emotions can be equally damaging when making individual investment decisions.
The consensus on Wall Street is for another solid year of market performance, with expectations centered around high single-digit to low double-digit returns as the AI-driven trade enters its third consecutive year. However, broad market expectations do not always translate directly into individual portfolio results. That distinction makes it especially important for investors to understand the difference between headline index performance and how a personally constructed portfolio actually behaves.
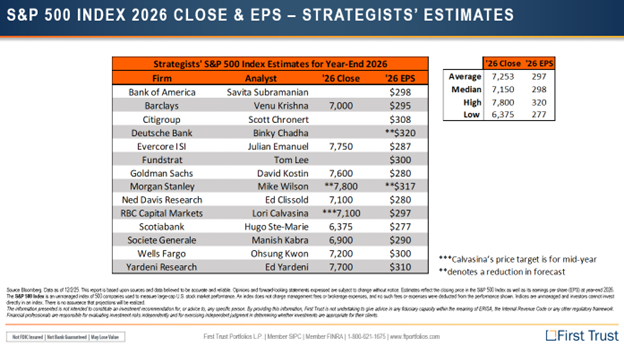
Each year, large financial institutions publish year-end price targets for the S&P 500, not as an attempt to predict the future with certainty, but to provide a framework for how they view the market’s direction in the year ahead. These estimates are based on a combination of factors, including investor sentiment, macroeconomic indicators, Federal Reserve, and White House policies. As shown in the chart below, most strategists are forecasting a positive year for the market, though not at the extraordinary levels seen over the past few years.
While analyzing the overall S&P 500 can be helpful, it is important to understand the key differences between a broad market index and an individually constructed portfolio. A portfolio is intentionally designed to align with an investor’s specific goals and circumstances. Whether that means generating income in retirement, preserving capital, or pursuing aggressive growth. When building a portfolio, considerations such as risk tolerance, time horizon, liquidity needs, and personal preferences all play a critical role.
Market indexes, on the other hand, are designed to serve as benchmarks. Indexes like the S&P 500 are standardized representations of a segment of the market and are primarily used to measure and compare portfolio performance. While investing in an index provides broad economic exposure, it does not account for an individual investor’s unique risks, financial objectives, or planning horizon.
For investors seeking broad market exposure, investing in a low-cost S&P 500 ETF or a total market index can make sense. In the industry, we often call this approach “cheap beta”. Simply meaning these investment vehicles aim to efficiently track the market, offering liquidity and minimal fees, without the need for active management.
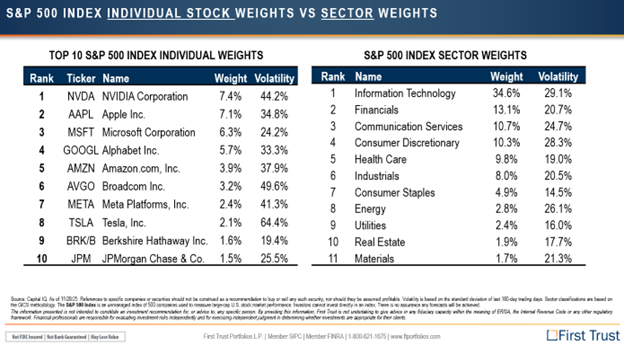
While this strategy works for some, it’s important to understand what’s happening beneath the surface of the S&P 500 index. Like any benchmark, the S&P 500 is constructed according to specific rules. It is market capitalization-weighted, which means larger, more valuable companies carry a greater influence on overall performance. As shown in the chart below, the top 10 companies alone account for just over 40% of the index. On the surface, it may appear you are investing across 500 companies, which you technically are, but in reality, nearly half of your exposure is concentrated in just 10 stocks. Looking more closely at sector weights, Information Technology alone makes up roughly one-third of the index. When combined with Communication Services, nearly 50% of the S&P 500 is tied to U.S. technology-related stocks. This level of concentration challenges the idea that the index provides broad diversification across the economy.
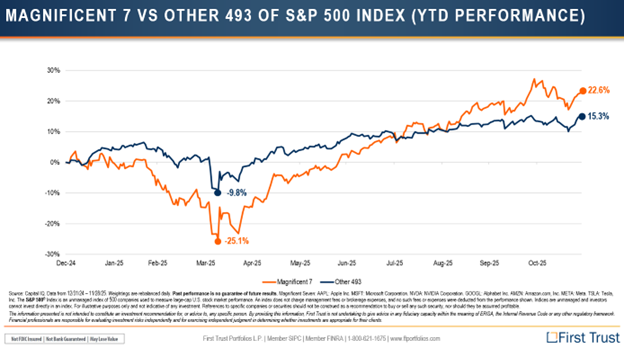
In the industry we refer to the largest US technology stocks as the “magnificent 7”. These individual companies have performed extremely well over the last decade, and even more recently surrounding the AI trade since the launch of ChatGPT in 2022. We can see in the chart below how the magnificent 7 performed in 2025 compared to the other 493. The magnificent 7 fell more dramatically in April to then finish the year up just under 23% compared to the remaining 493 at 15%. The magnificent 7 is in the driver seat when it comes to the overall market’s performance and it is critical to understand this when evaluating how your portfolio is currently invested.
The key takeaway is the significant impact of index investing on the market. Passive strategies now account for nearly 60%of all equity market flows. On a day-to-day basis, this means that a majority of stock purchases are not made by individual investors actively choosing companies, but by index funds, ETFs, and mutual funds buying the same stocks they already hold. A common example of this is bi-weekly 401(k) payroll contributions, which are automatically directed into mutual funds or index funds like the S&P 500. As noted earlier, these indexes are not equally weighted; larger companies receive a disproportionately bigger share of new investments. This is one reason why U.S. technology stocks continue to grow faster than many other sectors.
While there is nothing inherently wrong with passive investing strategies, it is important to understand how they work and how they fit into a tailored portfolio. As you approach retirement, your portfolio will often look very different than it did during your working years. Retirement portfolios are typically more strategic, incorporating a mix of asset classes, tax planning strategies, and risk management techniques, going beyond what a broad market index can offer. Regularly reviewing your portfolio, at least once a year, helps ensure that it remains aligned with your specific financial goals. Consulting a qualified financial advisor can provide guidance to keep your portfolio optimized for your individual needs.
Sources:
First Trust Monthly Strategy Deck
https://www.forbes.com/sites/wesmoss/2025/08/26/is-passive-investing-creating-a-bubble